Reporting
Reporting

Reporting

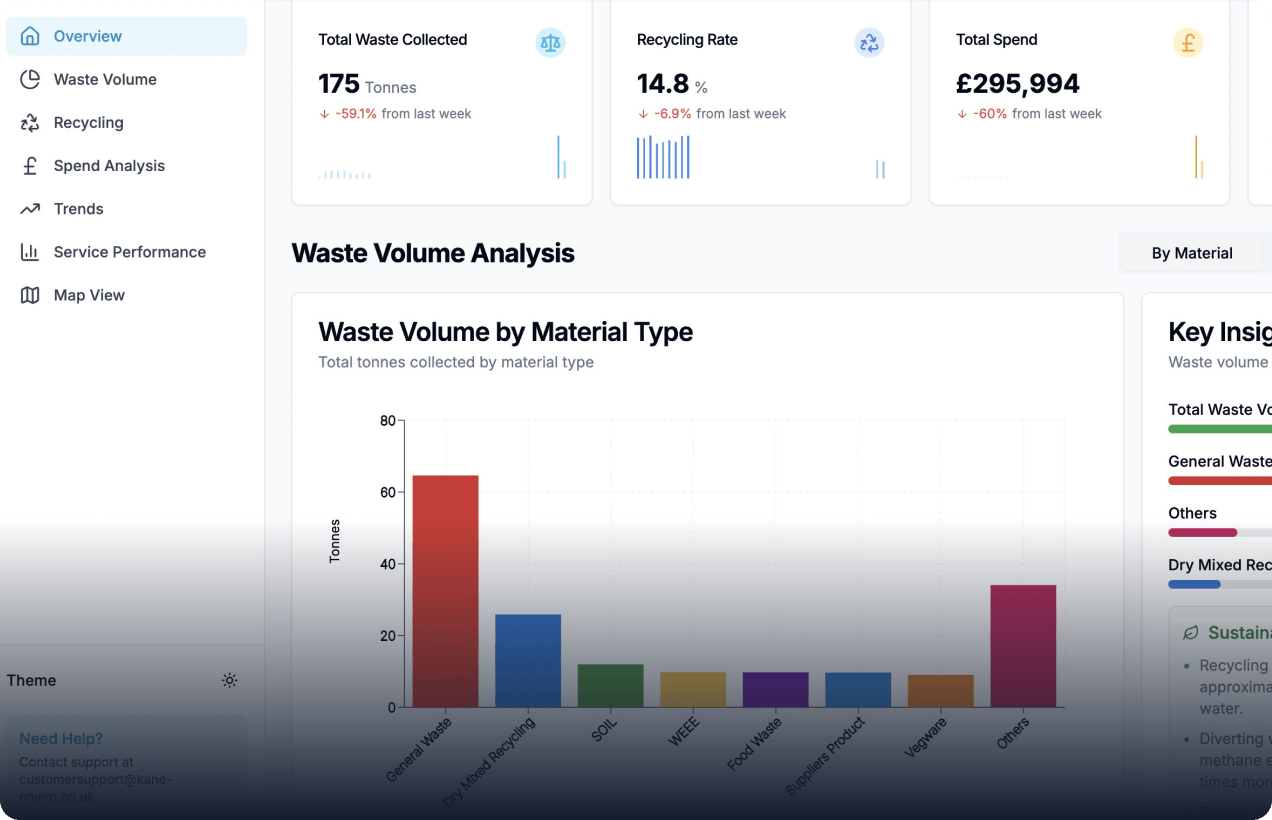
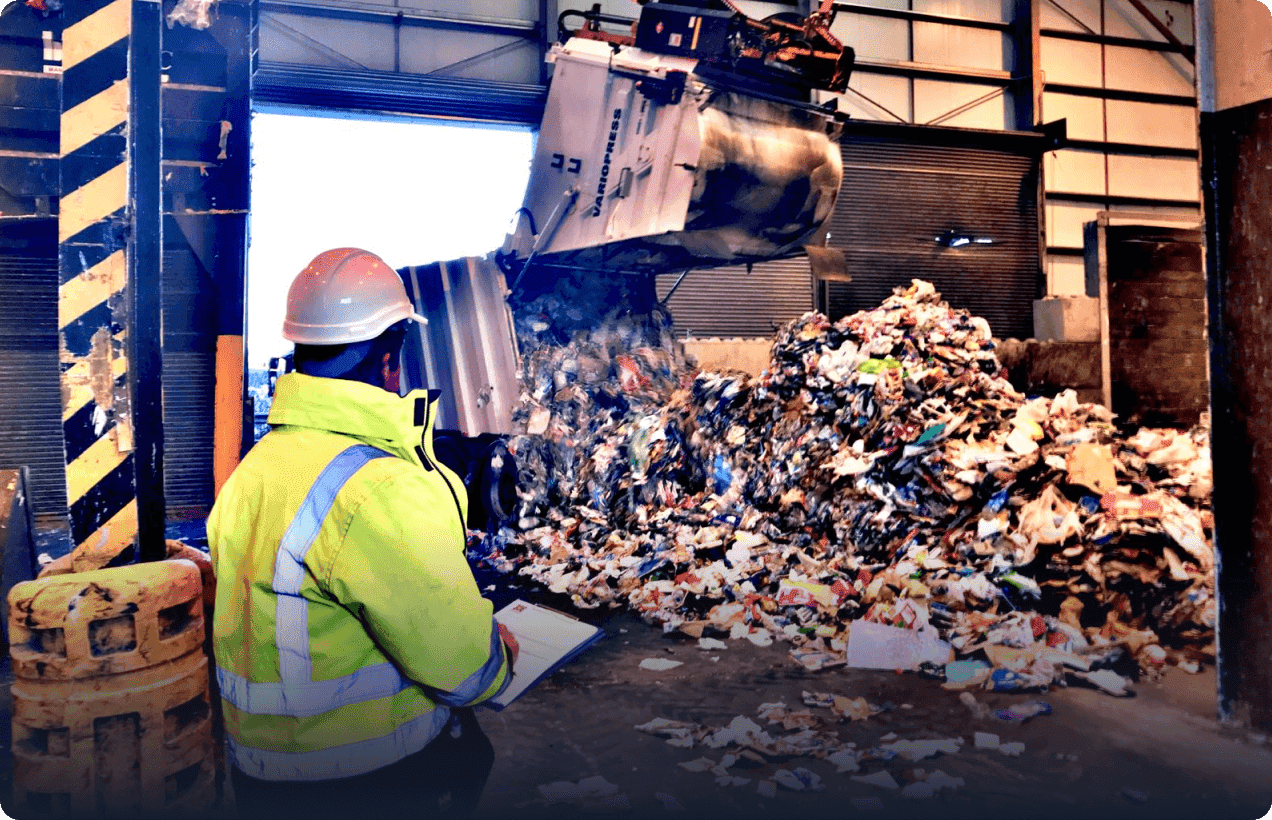
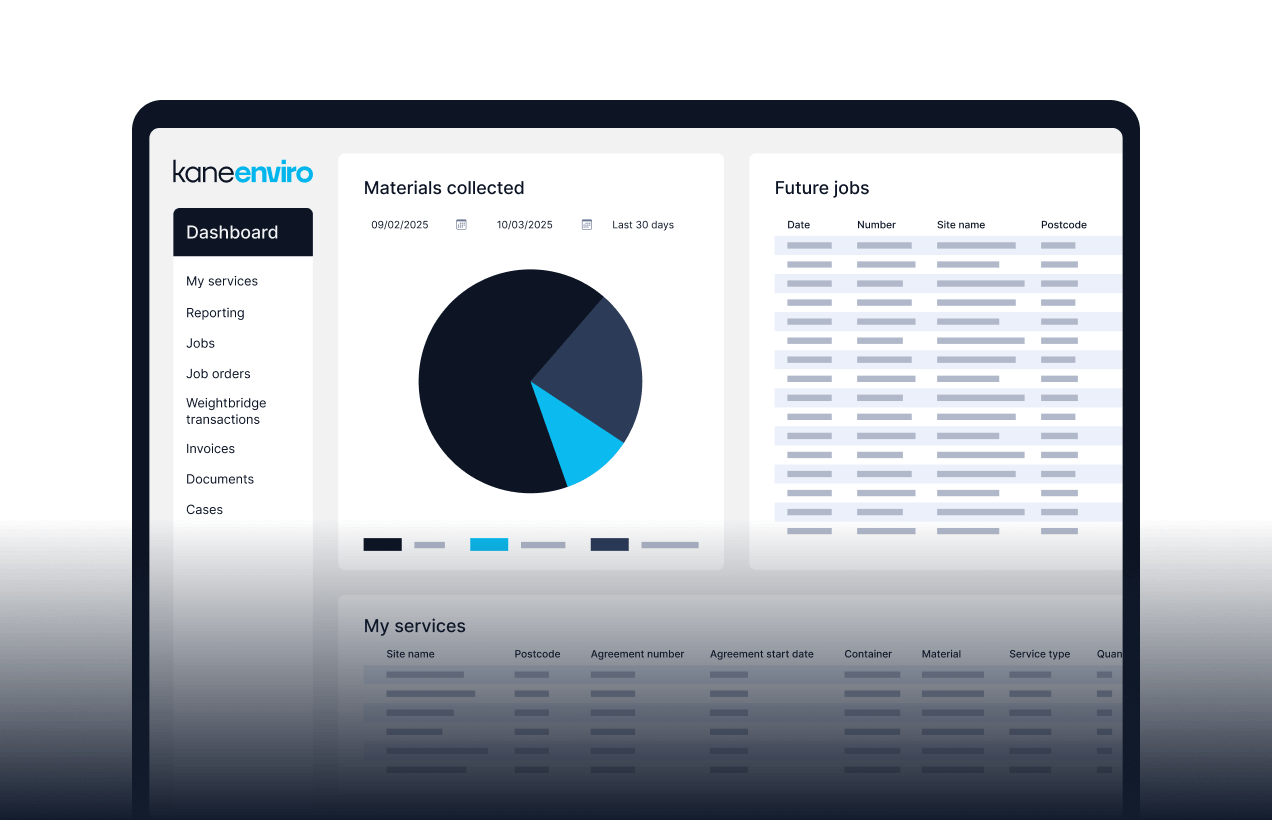
Kane Enviro's custom built bespoke dashboard and reports will give you full visibility and control of your waste and environmental data.

Reporting
Reporting - The importance of good quality data and reporting for your business.jpg
Real time data.svg

Data-Driven Success

The importance of good quality data and reporting for your business

In today's fast-paced and environmentally conscious world, businesses are increasingly recognising the critical role that good quality data and reporting play in environmental management and having access to accurate, comprehensive, and timely data is not just a luxury, it's a necessity. High-quality data and reporting provide many benefits that can significantly enhance operational efficiency, regulatory compliance, and overall sustainability efforts.

Benefits of good quality data and management

Enhanced Decision-Making

Enhanced 
Decision-Making.svg

Reliable and detailed data enable you to make informed decisions regarding their waste management strategies. By analysing data trends and patterns, businesses can identify areas for improvement, optimise resource allocation, and implement more effective waste reduction initiatives. This data-driven approach ensures that decisions are based on facts and insights rather than assumptions.

Regulatory Compliance

Regulatory Compliance (Light Blue).svg

Navigating the complex landscape of environmental regulations can be challenging. Good quality data and reporting can help you stay compliant with local, national, and international regulations. Accurate record-keeping and transparent reporting provide clear evidence of compliance, reducing the risk of fines and legal issues while demonstrating a commitment to environmental stewardship.

Cost Savings

Cost Savings (Light Blue).svg

Effective data management can lead to significant cost savings. By tracking waste generation, disposal methods, and associated costs, businesses can identify inefficiencies and areas where expenses can be reduced. Optimising waste management processes through data insights can lead to lower disposal fees, reduced resource consumption, and increased recycling revenues.

Sustainability Reporting and Corporate Social Responsibility (CSR)

Sustainability Reporting and Corporate Social Responsibility (Light Blue).svg

High-quality data is essential for sustainability reporting and CSR initiatives. Accurate and transparent reporting allows businesses to showcase their environmental performance, demonstrating their commitment to sustainability and responsible waste management. This can enhance a company's reputation, attract eco-conscious customers, and strengthen relationships with stakeholders.

Operational Efficiency

Operational Efficiency (Light Blue).svg

Comprehensive data and reporting can help you to streamline business operations. By monitoring key performance indicators (KPIs) and tracking progress against targets, businesses can identify bottlenecks, improve processes, and enhance overall operational efficiency. This proactive approach ensures that waste management practices are continually optimised for maximum effectiveness.

24/7 Online Portal

A 24/7 online portal for waste data is a powerful tool that provides users with real-time access to comprehensive waste management information.

Online portal - User Access.png

User Access

Users can securely log in with unique credentials and access the portal anytime, from any device with an internet connection, ensuring flexibility, convenience, and seamless access to waste management tools and data.

Online portal - Dashboard Overview.png

Dashboard Overview

Upon logging in, users can create a customisable dashboard that provides an overview of key waste management metrics and performance indicators. This may include waste disposal trends, recycling rates, cost summaries, and compliance statuses.

Real time reporting.png

Real-Time Monitoring & Reporting

Users can monitor waste management activities in real-time. The portal provides detailed reports and visualisations, such as charts and graphs, to help users analyse data trends and patterns. This real-time monitoring enables quick decision-making and timely adjustments to waste management strategies.

Compliance & Documentation.png

Compliance & Documentation

The portal keeps track of all regulatory requirements and ensures that users remain compliant with local, national, and international waste management regulations. It stores all relevant documentation, such as permits, audit reports, and compliance certificates, making it easy for users to access and submit necessary documents.

Data Security & Privacy.png

Data Security & Privacy

Ensuring the security and privacy of data is a top priority. The portal employs robust encryption, access controls, and regular security audits to protect sensitive information and maintain user confidentiality.

Continuous Improvement.png

Continuous Improvement

The portal supports continuous improvement by providing insights and recommendations based on data analysis. Users can identify inefficiencies, implement best practices, and set goals for waste reduction and sustainability.

Data Analysis

We will provide you with a comprehensive monthly report and access to our online portal and customer dashboard.
Waste Generation Data.png
Enhanced 
Decision-Making.svg

Waste Breakdown & Analysis

Waste Generation Data

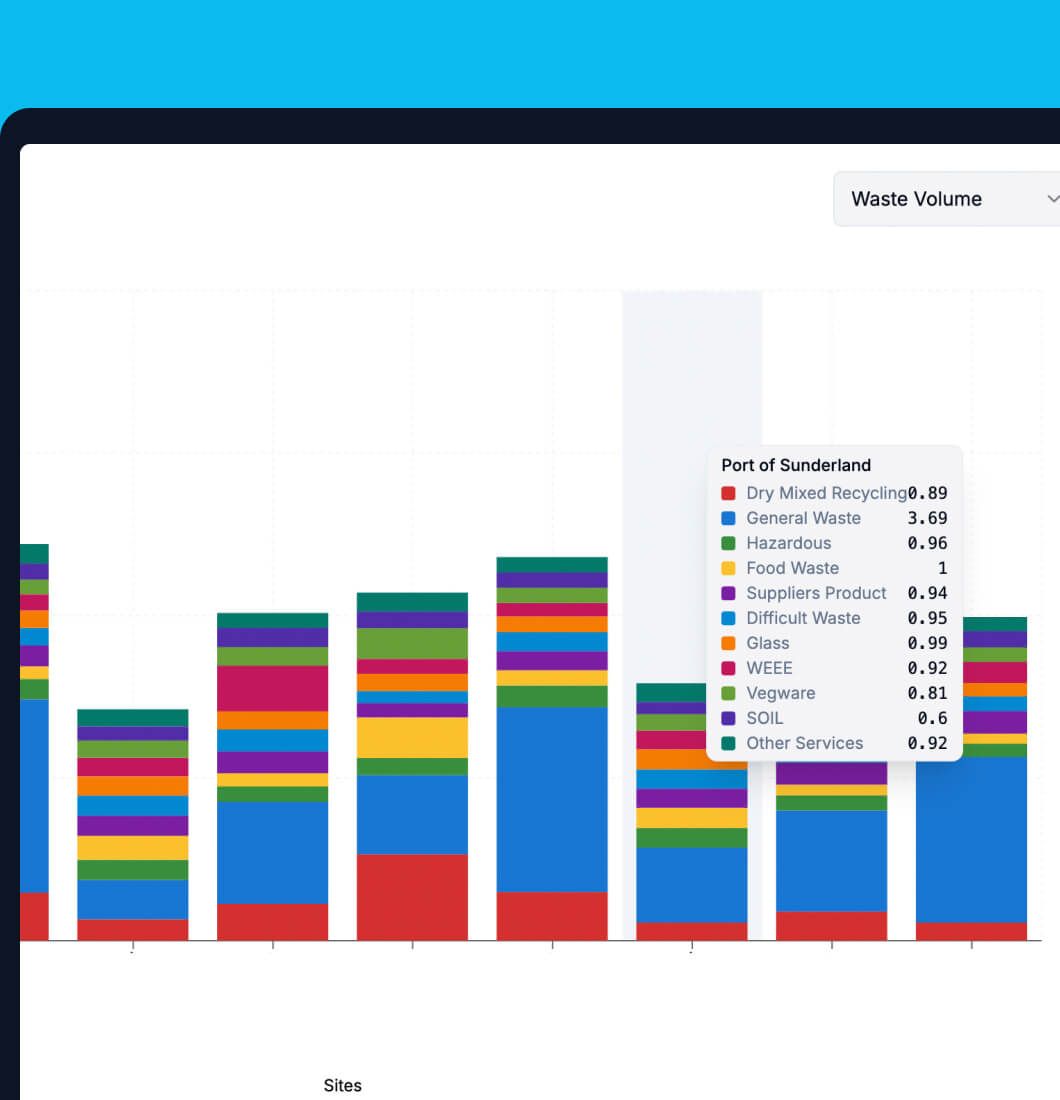
This section highlights the total amount of waste generated during the month, broken down by waste types (e.g., general waste, recyclables, hazardous waste), site and service type. It provides a clear picture of the waste output and helps identify areas for improvement.
End Destination.png
Recycling.svg

Maximise recycling, minimise landfill

Recycling Rates & Waste Diversion

The report details the percentage of waste that was successfully diverted from landfills through recycling and other means. It tracks the progress of recycling efforts on a month on month basis and highlights areas where improvement can be made.
Cost analysis.jpg
Best Value Offering.svg

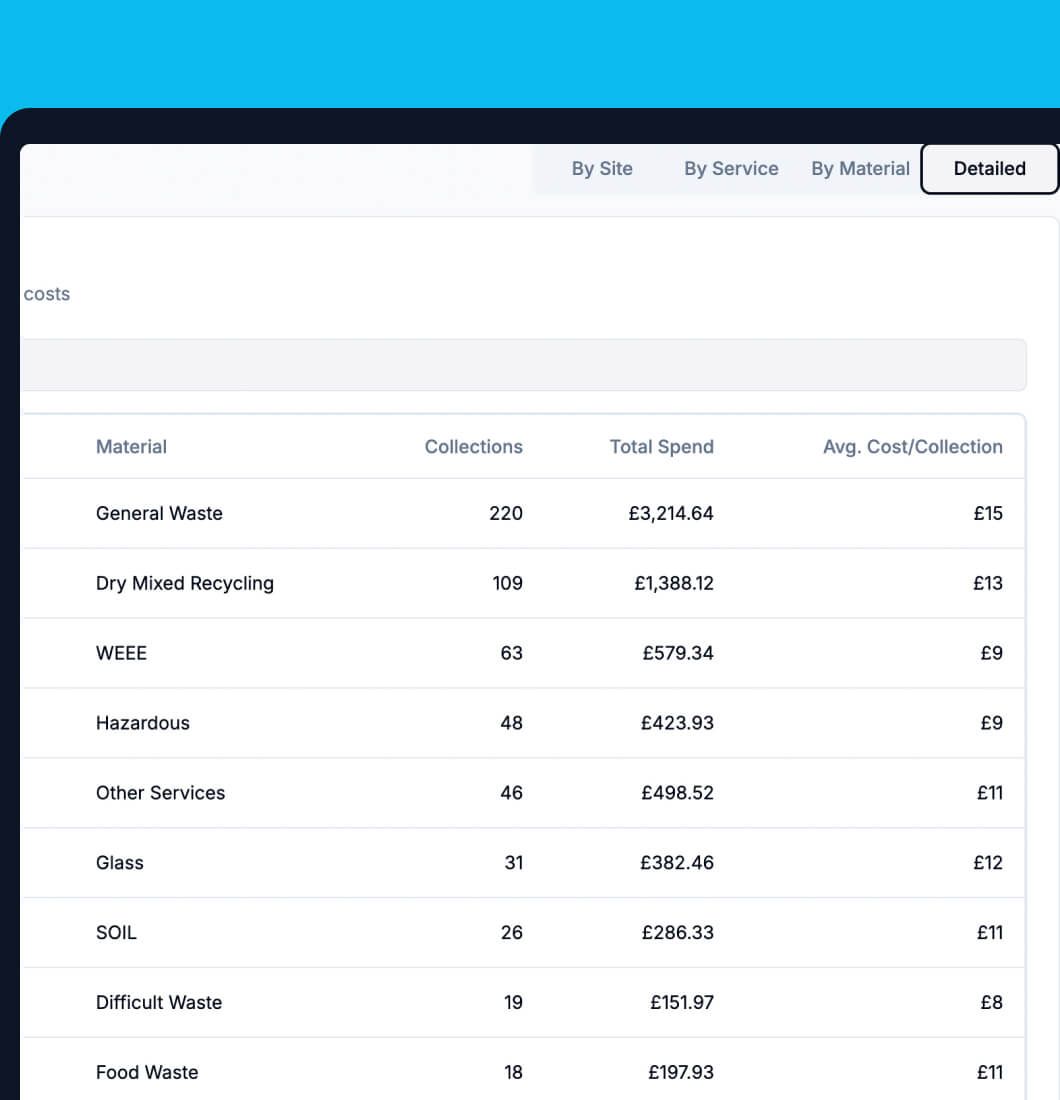
Waste & recycling cost summary

Cost Analysis

A financial summary that outlines the costs associated with waste and environmental management services, including collection, disposal, and recycling costs.

Compliand and Regulatory Updates.jpg
Compliance.svg

Stay ahead of regulations

Compliance & Regulatory Updates

This section ensures that the customer is aware of any regulatory changes and compliance requirements. It provides updates on audits, permits, and any actions taken to meet environmental regulations.
Operational Efficiency.jpg
Real time data.svg

Streamline performance insights

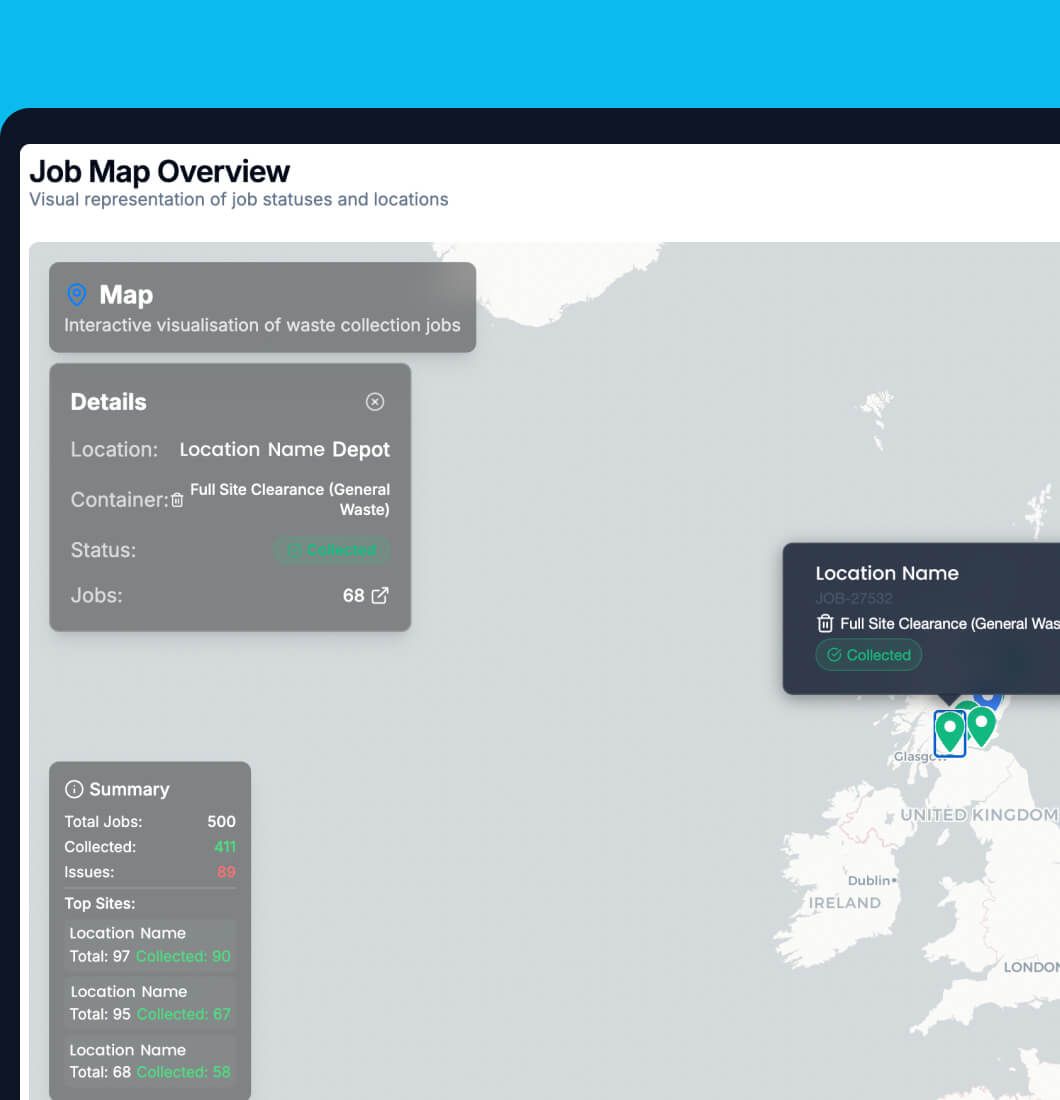
Operational Efficiency

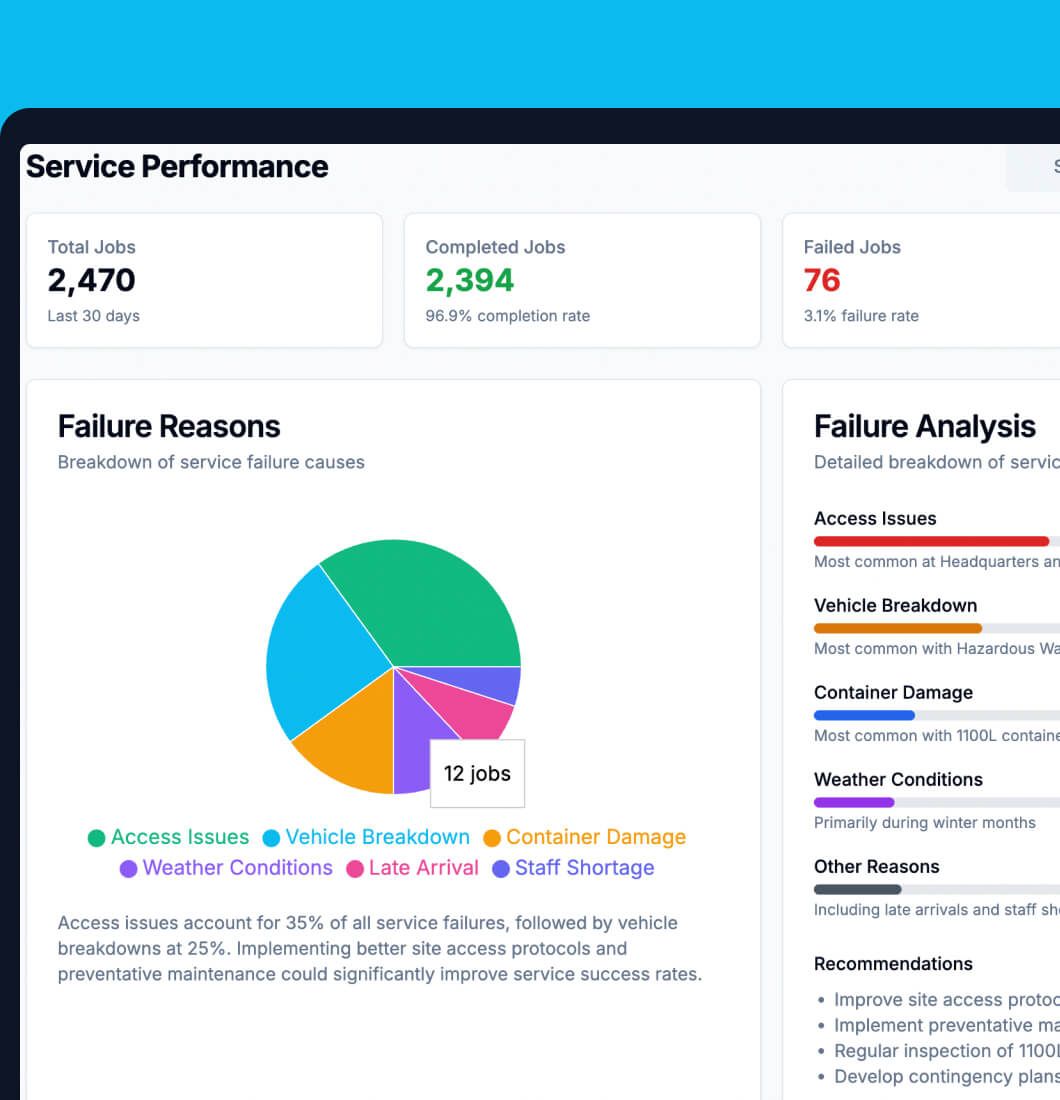
An analysis of the efficiency of waste management operations, including collection schedules, service delivery, and any incidents or issues encountered during the month.

Reccomendations & Action Plans.jpg
leaf.svg

Next steps for improvement

Recommendations & Action Plans

Based on the data and analysis, the report provides actionable recommendations for improving waste management practices. It may suggest ways to increase recycling rates, reduce waste generation, or optimise service schedules.

Environmental Impact.jpg
Environmental Consultancy.svg

Measured environmental benefits

Environmental Impact

This section assesses the environmental impact of the customer’s waste management practices, including carbon footprint calculations and other relevant metrics. It demonstrates the environmental benefits achieved through responsible waste management.
Visualisations & Summaries.png
Proactive supplier audits & transparency.svg

Data made clear and visual

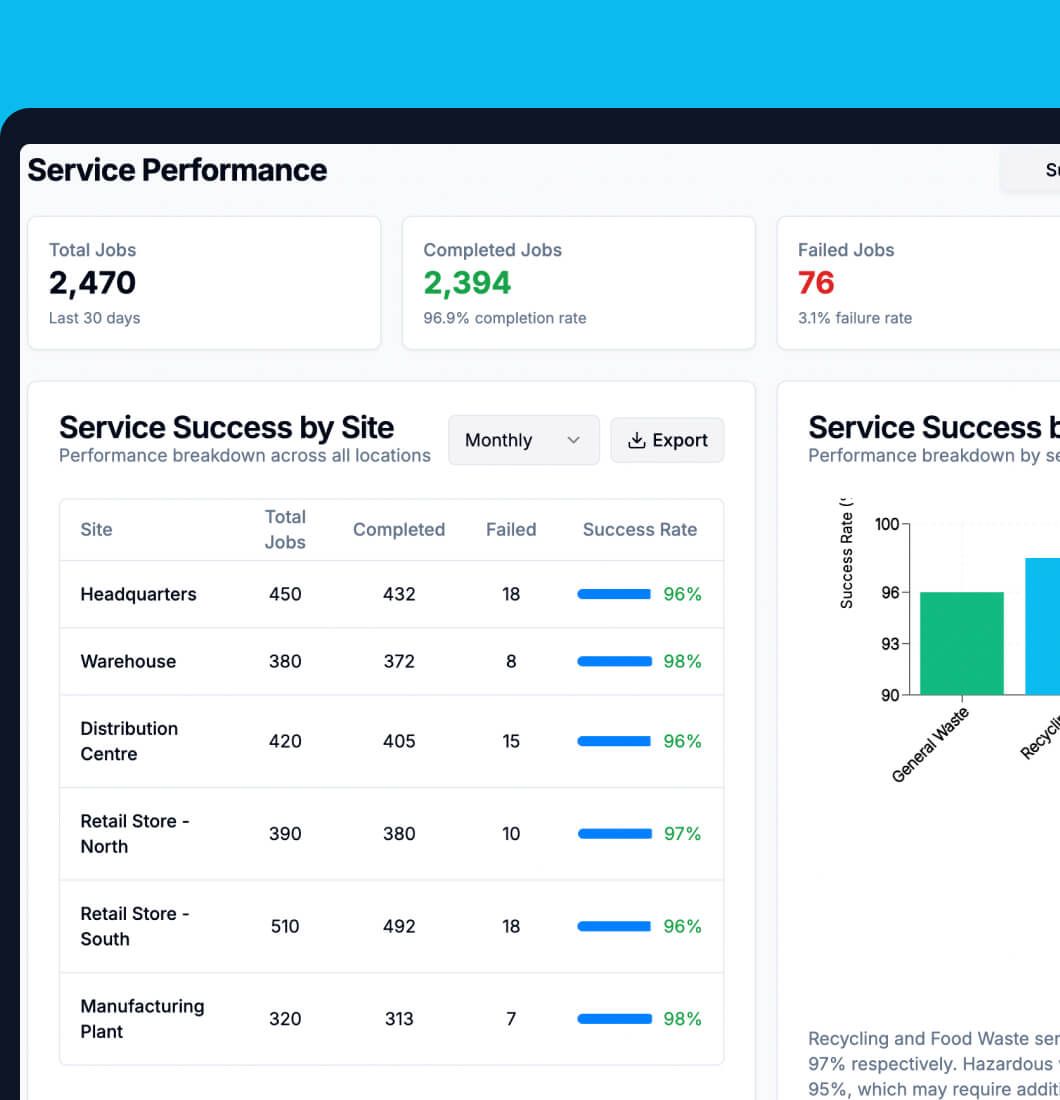
Visualisations & Summaries

The report includes charts, graphs, and summaries to present the data in a clear and easily understandable format. Visualisations help highlight key trends and insights at a glance.

Personalised Dashboarding

We will provide you access to your dedicated Dashboard which will document your waste and recycling performance, all in one place!
Real time data.svg

Data Visualisation

Create visually appealing and interactive reports and dashboards to simplify complex data.

On-Time Service.svg

Real-Time Data Access

Access real-time data from various sources, ensuring up-to-date information for decision-making.

User-Friendly Interface.svg

User-Friendly Interface

Intuitive interface with drag-and-drop functionality for easy reporting.

Customer Focused.svg

Collaboration and Sharing

Easily share reports and dashboards with colleagues and stakeholders for seamless collaboration.

Update your browser to view this website correctly. Update my browser now

×